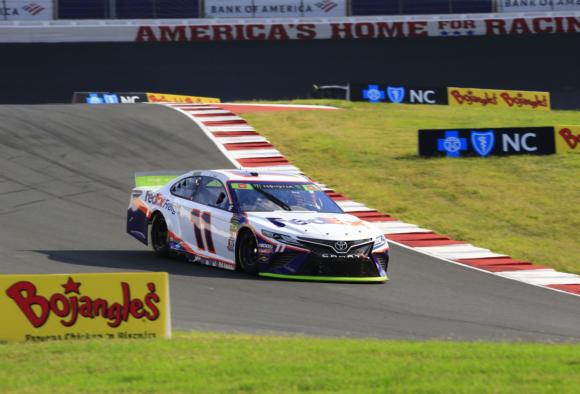
Prior to Sunday’s Bank of America ROVAL™ 400, Charlotte Motor Speedway staff researched the average road-course finishes of all 16 Monster Energy NASCAR Cup Series Playoff drivers since 2017.
Here are the results for Playoff drivers – and three non-Playoff drivers who could be bracket busters:
Road Course racing stats from 2017 to 2019
| Driver | Road Course Average finish | Road Course Poles | Road Course Wins | 2018 ROVAL™ Finish |
| Denny Hamlin | 7.29 | 1 (Watkins Glen 2018) | 0 | 12 |
| Kevin Harvick | 7.43 | 0 | 1 win (Sonoma ‘17) | 9 |
| Clint Bowyer | 7.86 | 0 | 0 | 3 |
| Kurt Busch | 8 | 1 pole (ROVAL™ ‘18) | 0 | 5 |
| Martin Truex Jr. | 8.29 | 0 | 3 (Sonoma ‘18/’19, Watkins Glen ‘17) | 14 |
| Kyle Busch | 9.29 | 1 pole (Watkins Glen ’17) | 0 | 32 |
| Chase Elliott | 10 | 1 (Watkins Glen ‘19) | 2 wins (Watkins Glen ‘18/’19) | 6 |
| Ryan Blaney | 10.29 | 1 (ROVAL™ ‘18) | 0 | 1 |
| Alex Bowman | 11 | 0 | 0 | 4 |
| Erik Jones | 12.71 | 0 | 0 | 30 |
| Aric Almirola | 13 | 0 | 0 | 19 |
| Brad Keselowski | 15.29 | 0 | 0 | 31 |
| Kyle Larson | 16 | 3 Poles (Sonoma: ‘17,’18, ‘19) | 0 | 25 |
| Ryan Newman | 18 | 0 | 0 | 11 |
| Joey Logano | 21.14 | 0 | 0 | 10 |
| William Byron | 21.4 | 0 | 0 | 34 |
| Jimmie Johnson | 17.43 | 0 | 0 | 8 |
| Matt DiBenedetto | 17.71 (finished 4th at Sonoma and 6th at WGI this year) | 0 | 0 | 13 |
| Daniel Suarez | 11.86 | 0 | 0 | 21 |
TICKETS:
To purchase Bank of America ROVAL™ 400 tickets, fans can call 1-800-455-FANS (3267) or shop online at www.charlottemotorspeedway.com.
Kids 13 and under get in FREE for the Drive for the Cure 250 presented by Blue Cross Blue Shield of North Carolina on Saturday. Kids’ tickets to the Bank of America ROVAL™ 400 cost just $10.
CMS PR


